The first thing to do is to compile a Java program to be analyzed. If you would like to only visualize an example data in a distribution archive, please skip this section.
The current version includes amida-agent.jar, that is an implementation of
byte code transformation, to record an execution trace of a Java program.
Amida has a configuration dialog to execute a Java program with the amida-agent.
You can execute Amida as follows.
(Windows) java -classpath swt.jar;trove-2.0.3.jar;amida.jar amida.Amida
(Other)   java -classpath swt.jar:trove-2.0.3.jar:amida.jar amida.Amida
Select [Profile a Java program] in its menu.

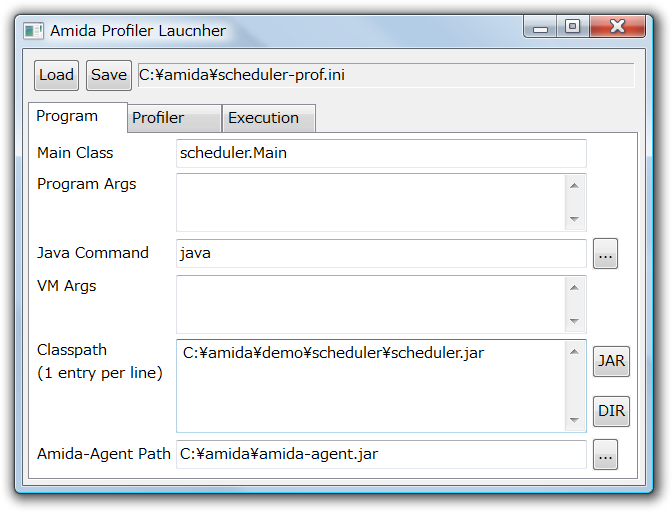
Amida Profiler Launcher dialog have widgets to specify
a Java program information.

This is an example to execute a scheduler program.
[Profiler] tab includes options for a profiler.
You must specify [Log Output Directory].

Then, you have to click on Save button in order to save
the configuration to a .ini file.
This is because amida-agent.jar needs the configuration file for its execution.
After saving a configuration,
[Execution] tab shows a command line
to execute a Java program with a profiler.

Clicking on [Profile the Java Program] button launches the Java program.
[Execute the command as a batch file for Windows] button saves the command line as a batch file
and executes it.
After an execution,
log files are stored to a new directory, whose name is the same as timestamp, created in Log Output Directory.
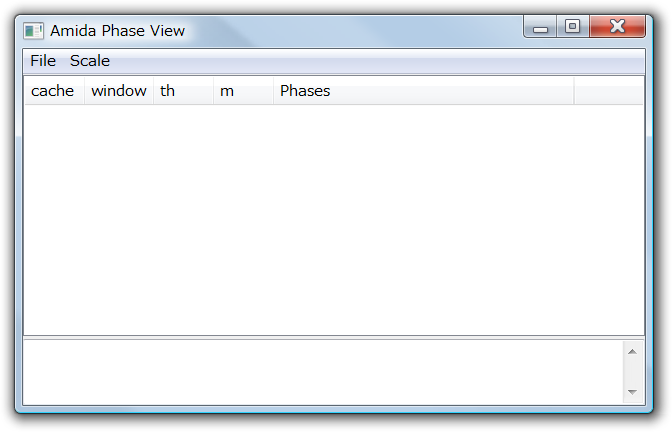
You may apply phase detection, or
simply visualize a log file.