What is Gemini component?
Gemini component graphically provides the information of code clones detected by CCFinder. Gemini component is an enhanced version of the old Gemini. There are two types analyses in Gemini, File Base Analysis and Clone Base Analysis. In the File Base Analysis, the user investigate files, for example, which file has more code clones than other files. In the Clone Base Analysis, the user investigate code clones, for example, which code clone is bigger than other code clones.
FILE BASE ANALYSIS
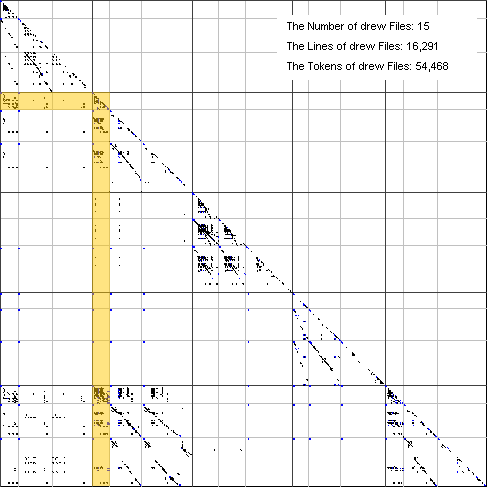
In the File Base Analysis, the user investigates how each file has code clones, or which files share code clones to another, or other characteristics of target files. The following views are used in the File Base Analysis.
- the Scatter Plot
- the Directory Tree
- the File List
- the Group List
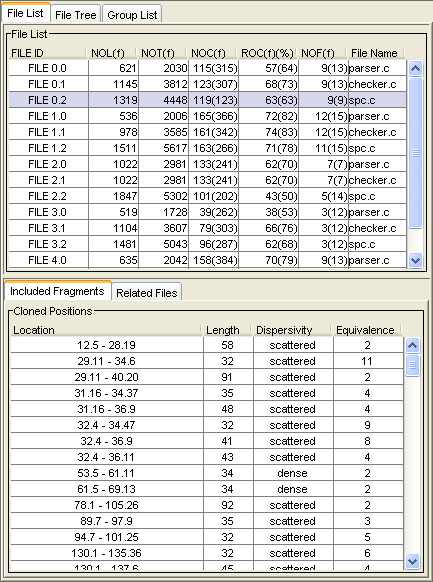
Also, quantitative information is provided in the File Base Analysis. The File List provides the quantitative characterictics of each file. The left figure is a snapshot of the File List. Each row of the File List represents a file and its metrics. The user can get the state of each file, for example, which file has more code clones than other files. The File List has two sub-lists, the Fragment list and Related File List. If the user selects a file in the File List, the Fragment List shows all code clones included in it, and the Related File List shows all files which share code clones with it. The Group List provides quantitative information to the user. But in this view, the unit is not file, but group. A group means a set of files. CCFinder has a function detecting inter and intra code clones of every group. If you build a group from file in a directory or in a module and detect code clones, you can get quantiative information of directories or modules and their similarity..
CLONE BASE ANALYSIS
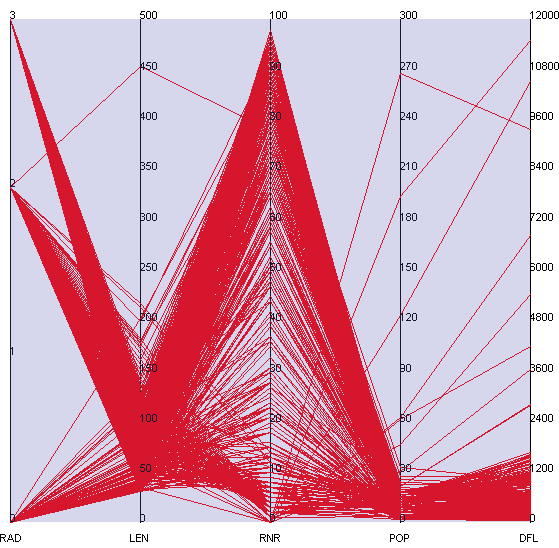
In the Clone Base Analysis, the user investigates code clone based on their characteristics. The Metric Graph is mainly used to filter code clones in this analysis. The left figure is a snapshot of the Metric Graph. The Metric Graph uses 5-metrics currently. The Metric Graph has been implemented as a parallel coordination graph. A vertical axis is prepared for each metric. A dot is plotted on each axis based on its value and each adjacent dot was connected by a line. So, a clone set is represented as a polygonal line. In the Metric Graph, the user filters code clones(clone sets) by changing each upper or lower limit.
Of cource, the user can get quantitative information. In the Clone Base Analysis, quantitative information is represented on the Clone Set List. The Clone Set List shows only clone sets filtered on the Metric Graph. Firstly, the user filters clone sets on the Metric Graph roughly, and after that, uses the Clone Set List to get more detail information for filtered clone sets.
Copyright © 2005-2007 Software Engineering Laboratory All Rights Reserved.